Info
| Name | Gold Price Graph jQuery Plugin |
| Market | codester.com |
| Category | Miscellaneous |
| Tags |
Overview
Description
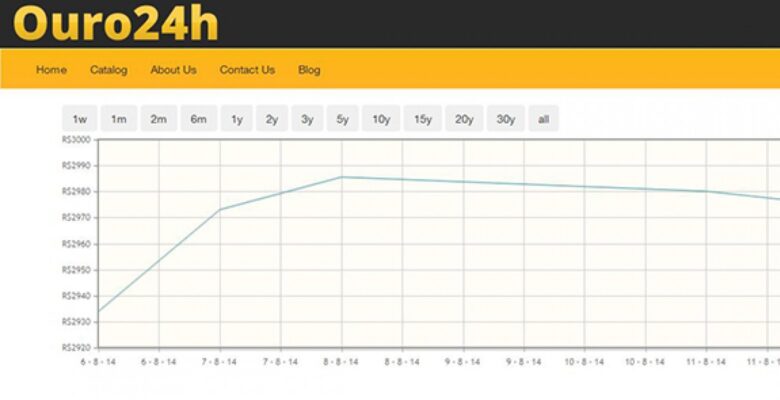
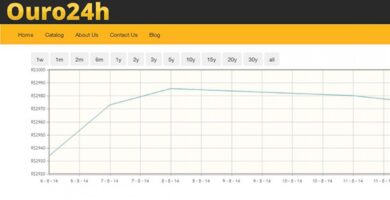
Javascript plugin that enables the creation of a liner graph with the gold price. Users can choose the range of data, for example, display a liner graph from of the gold price from 2001-01-01 to 2014-01-01. It can also be used to display the current gold price.
Features
- Create linear graphs with the gold price
- Add filters to the graphs
- Display the current gold price
- Conversion to any currency
- Support various currencies
Included
- Source code
- Example
Requirements
- jQuery
- jqplot
- momentjs
Instructions
Just create a new div do container the graph and call the window.goldprice.renderGraphic function with the class of that div and from when to now would you like the date to be displayed.
