Info
| Name | jVectorMap – Interactive Vector Maps |
| Market | codester.com |
| Category | Miscellaneous |
| Tags | country, data visualization, legend, map, marker, region, vector, world |
Overview
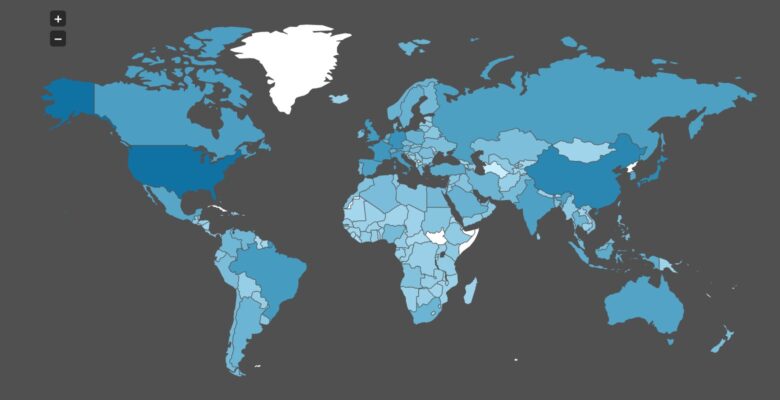
A full-featured library for embedding vector-based maps on the webpages. A lot of maps provided with the library, custom maps can be generated with converter. Works perfectly on mobile platforms.
Features
Data visualization
Visualize your data on the map. Use regions or markers to represent different features of your data. Easily setup auto generated legends to make a visualization easy to comprehend.
Interactivity
Using documented API you can handle various events from the map like hovers, clicks, label displaying and customize the behavior of the plug-in.
Maps
Various maps of the world, world regions, countries and cities are available for download from the official website. All of them are made from the data in public domain or data licensed under the free licenses, so you can use them for any purpose without any charge.
Converter
Library package includes a map converter written in Python. It’s used to create maps available on the library’s website. If you want to create some custom map you can create it using data in common GIS formats like Shapefile.
Standards compliant
For identification of the countries and regions ISO 3166 standard is used. So you easily visualize data which is compliant with this standard.
Requirements
jQuery 2+
Instructions
Please follow the instruction on the official website.
Full API reference can be found here.